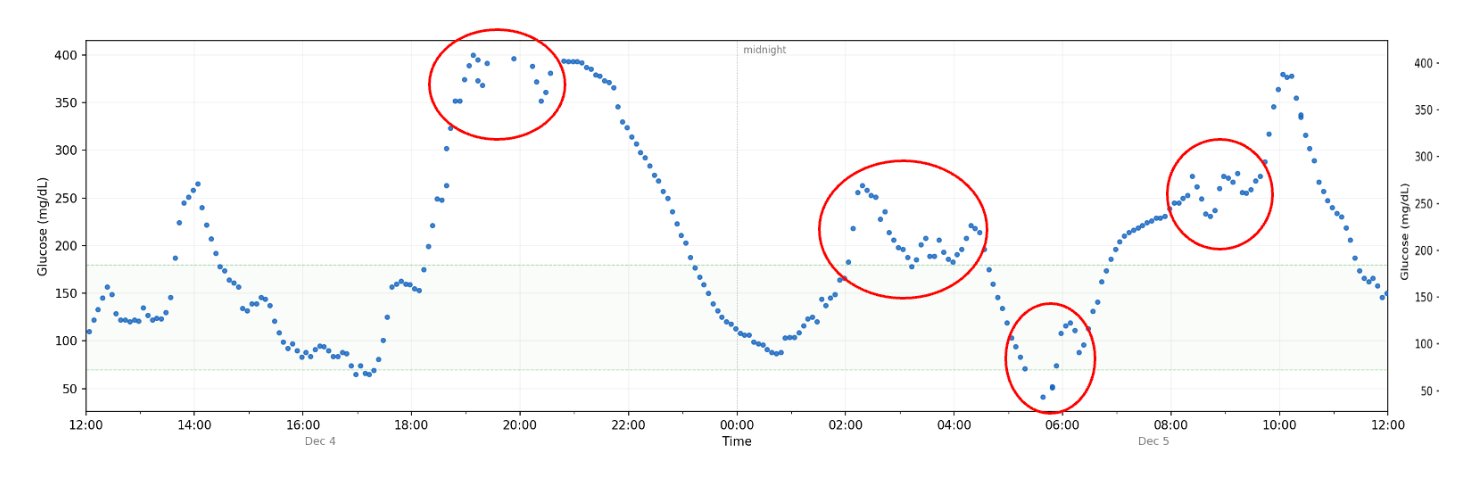
In December 2025, a woman we'll call Jane Doe went into a hypoglycemic coma because her automated insulin pump dosed too much insulin. When the CGM data was examined, the reason was clear: her sensor had produced clusters of zig-zagging, incoherent, physiologically impossible glucose readings that didn't represent her actual glucose levels. Her pump algorithm didn't know the difference. It just dosed. This chart illustrates the zig-zagging clusters of CGM noise from her sensor.
This is not a rare or isolated problem. CGM sensors produce these kinds of anomalous reading clusters regularly, across sensors and manufacturers. Automated insulin delivery systems -- which make dosing decisions continuously and autonomously -- have no reliable way to know when the data they're acting on has gone bad.
After encountering this problem, I spent several months building a detection algorithm that identifies statistically anomalous clusters of readings -- sequences that are physiologically implausible given what glucose can actually do in the human body. In testing across a wide variety of real-world datasets, strong correlations emerged between these clusters and subsequent hypoglycemic events, including nocturnal hypoglycemia.
Below is a chart of glucose levels produced by my algorithm -- and what this site will produce. The red boxes are "critical" clusters and the orange boxes are "elevated" clusters, representing the severity of the noise -- hence, the reliability of the glucose values. The numbered labels identify hypo events that follow a cluster. Black represents a nocturnal hypo; yellow represents daytime hypos.
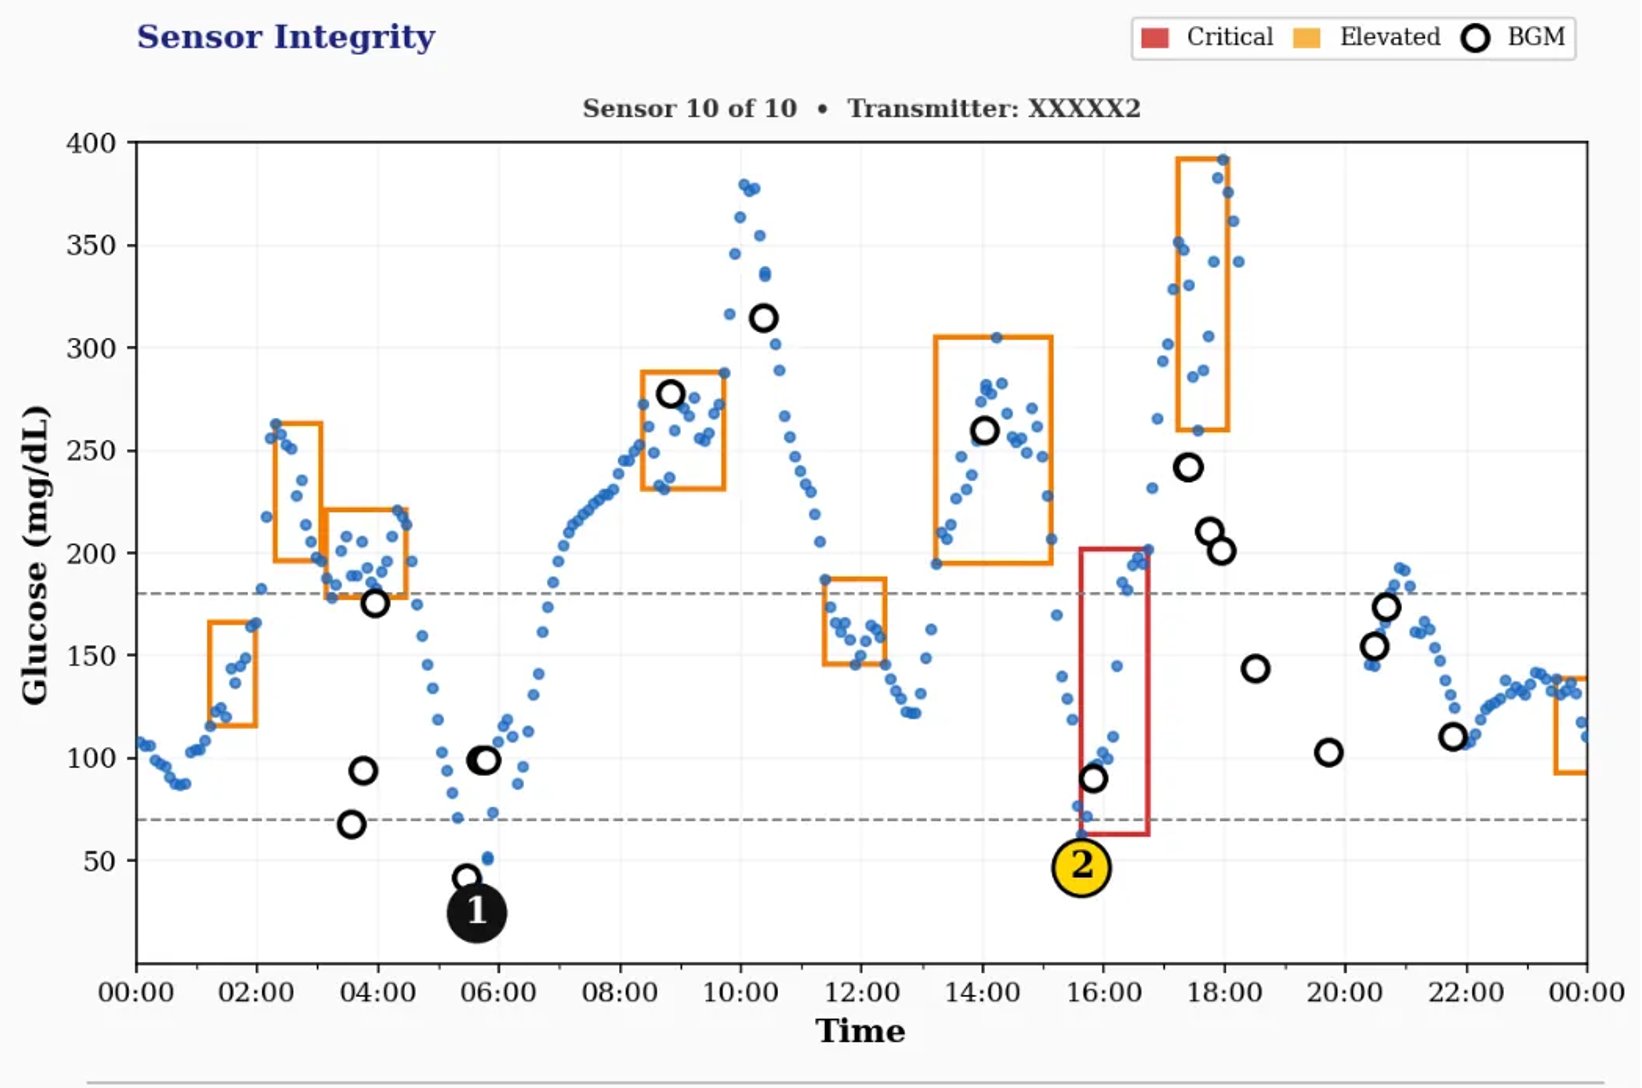
Notice the black circles. These represent manual BGM readings that Jane did. Many times, they matched the CGM readings. But at 3:30am, she had several readings that were over 100 mg/dL lower than what the CGM said, and her pump algorithm never knew it. That's why it kept dosing insulin, leading to her coma.
You can read more about this story and the development of this algorithm in my article, The CGM Patent That Could Save Lives. The source code that runs this tool is available on GitHub under an MIT license, making it free for anyone to use, commercially or for research purposes.
PurpleSensor is a public web interface for the same detection algorithm described above. Upload a CGM export file and the engine analyzes it for sensor integrity anomalies, then generates a report showing where clusters occurred, how severe they were, and whether hypoglycemic events followed.
Every file submitted is processed and deleted immediately. No information about you, your glucose data, or anything else is stored. The health of the sensors detected in the data you provide are used to build an independent, publicly sourced dataset on CGM sensor performance across sensors over time. That dataset doesn't exist anywhere else.
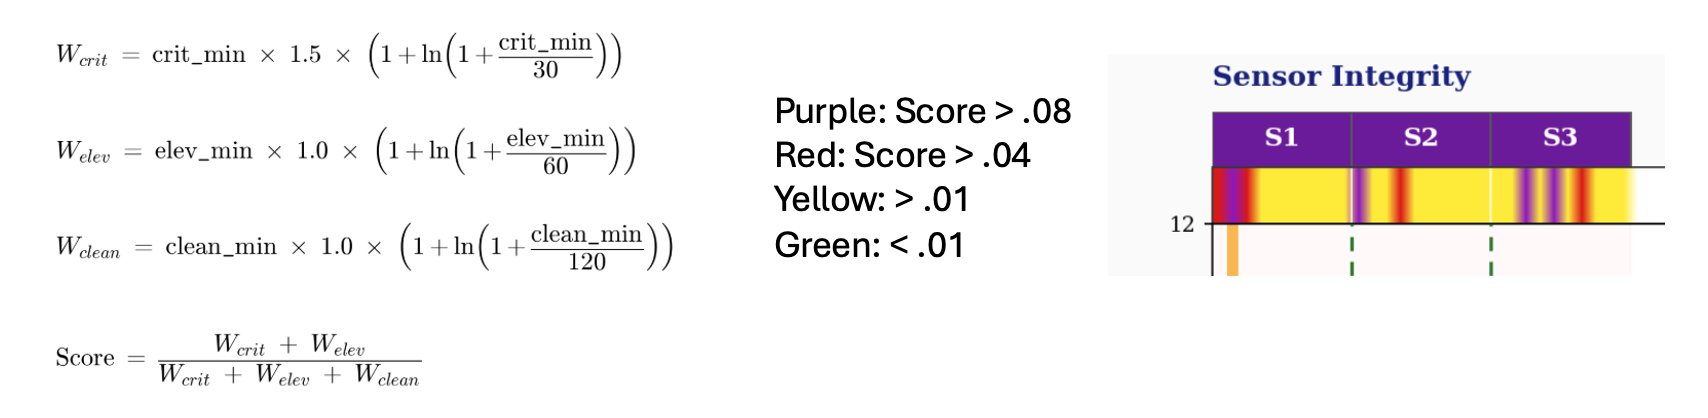
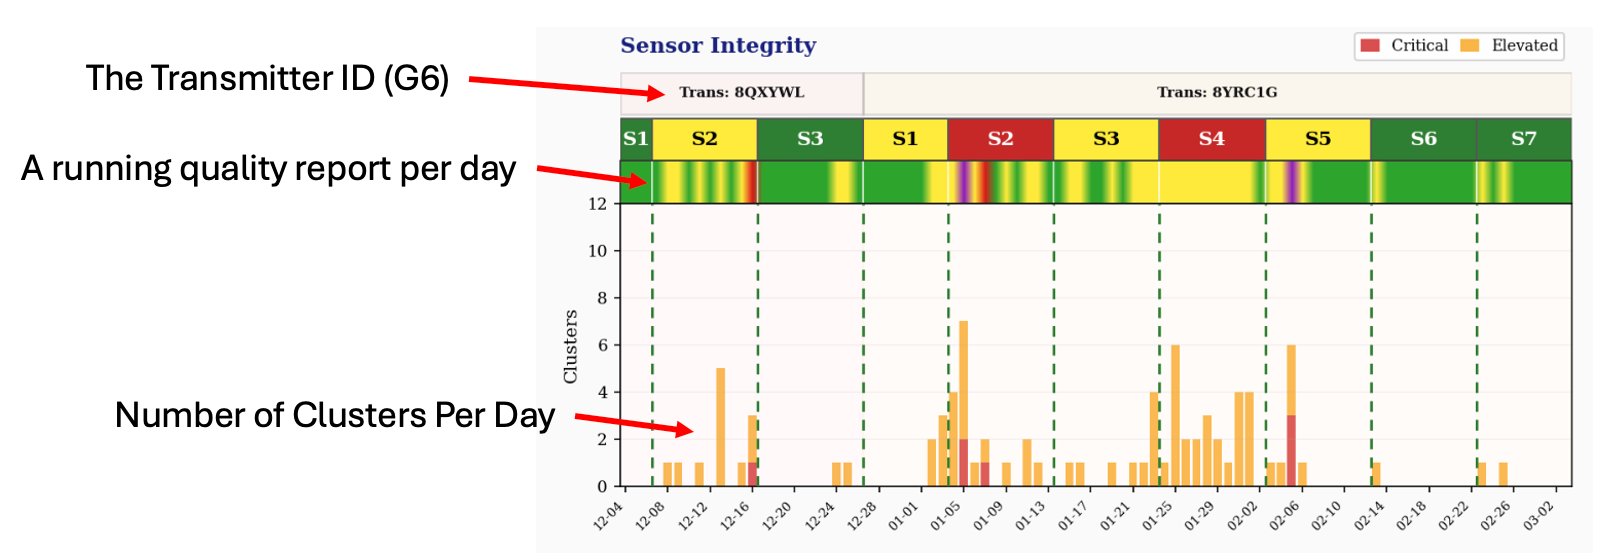
The health of a sensor is established by looking at the amount of time the sensor is either free of any noise versus the severity of the noise. Sensor quality is then scored to produce a color: green is a sensor clear of any appreciable noise, whereas purple is the worst. Each sensor in a dataset (usually 90 days) is evaluated. Below is the math used to determine sensor health.
Below is a sample dashboard generated from real-world data, showing the sensor integrity summary across multiple sensors and the cluster history over time.
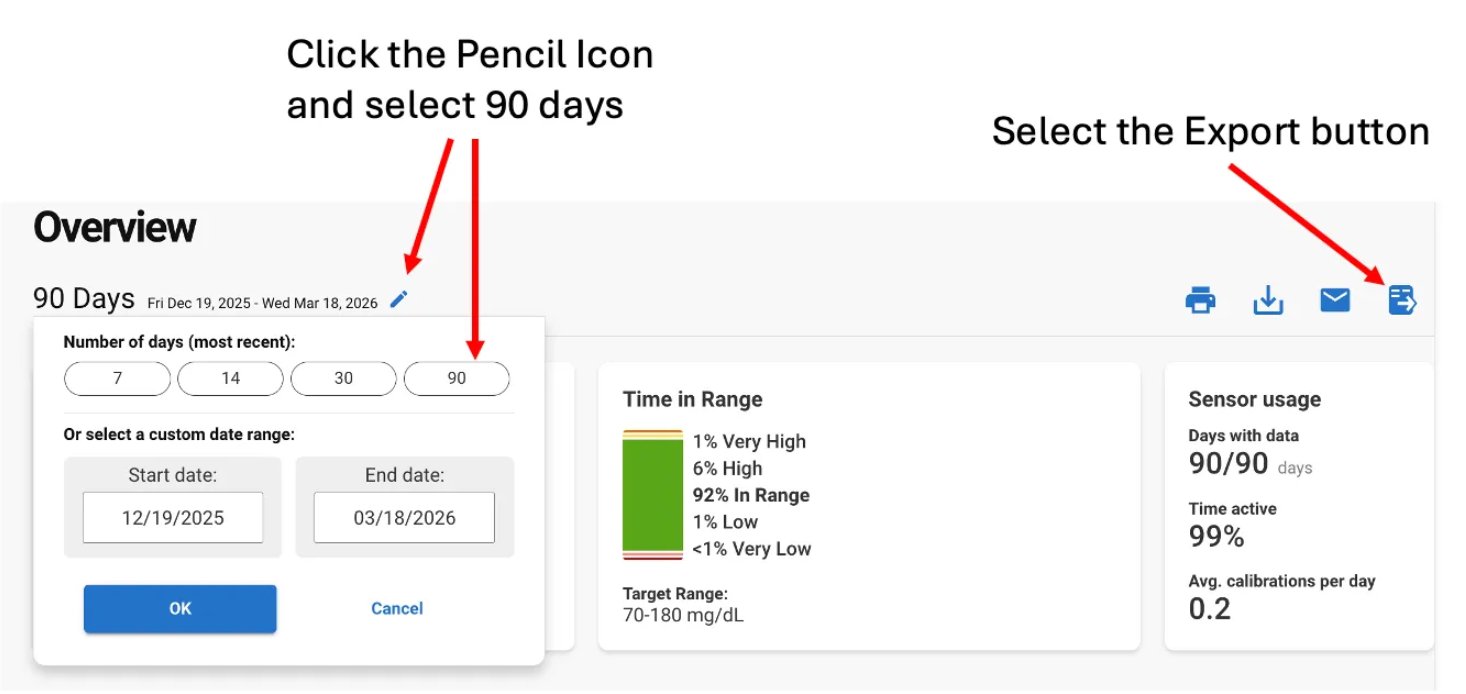
Dexcom's Clarity patient portal is shown below. First, login to clarity.dexcom.com, select a time span -- I suggest 90 days -- and choose the Export button, not the Download button. You want the raw data in CSV format, not a PDF report.